JSON Visualizer
A developer-focused visualization tool that transforms raw JSON into interactive connected graphs.
A developer-focused visualization tool that transforms raw JSON into interactive connected graphs.
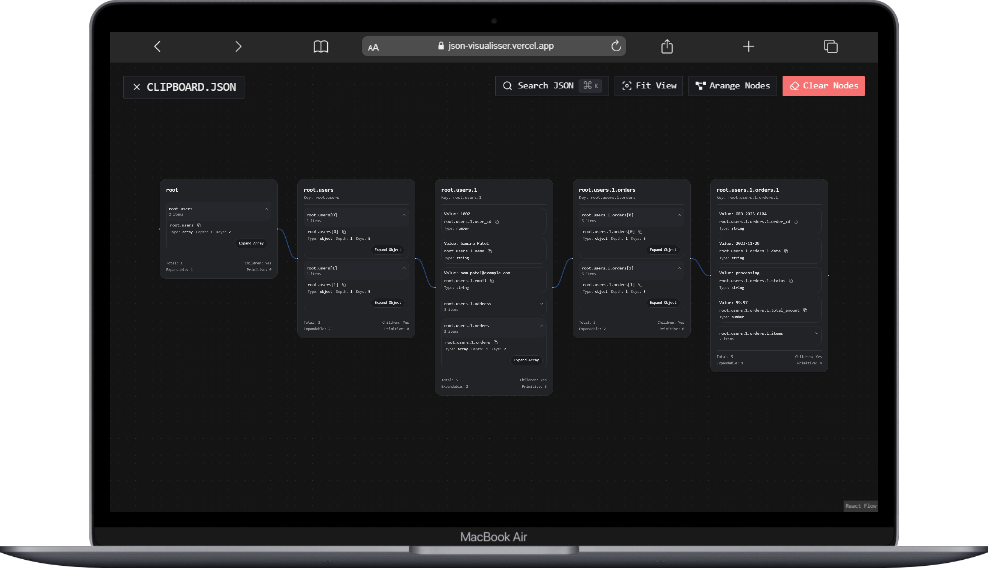
Graph demo screenshot of the Json Vissulaizer of how the node view works
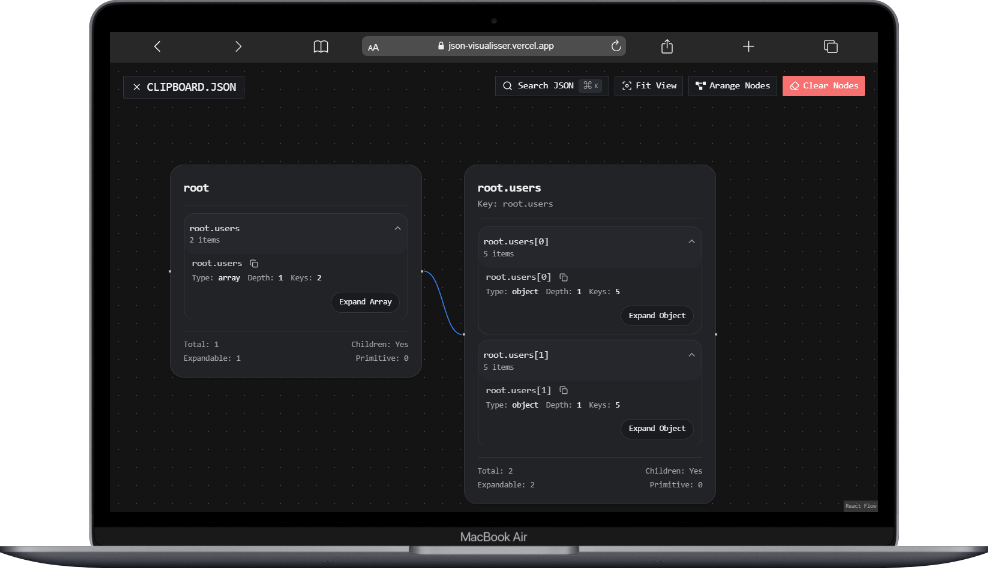
Demo screenshot of the Json Vissulaizer on a laptop rsponsive screeen
Challenge: Deeply nested JSON can become difficult to read and reason about in plain text. Approach: Built a recursive visualization engine using React Flow that converts objects, arrays, and keys into connected interactive nodes. Outcome: Developers can visually inspect, explore, and better understand complex JSON structures through drag, zoom, and real-time rendering.
This is simple walthrought on how to work with the application.
The display and usecase of the Graph state of the json data
A responsive lapptop view of the application use in large screens
A responsive mobile view of the application use in mobile screens
Demonstration of the entire application flow
Turns complex JSON into interactive visual graphs. Makes nested data easier to inspect, debug, and understand.